
Check current bookings by room and weekday, identify the real occupancy gap and use a practical 30-day plan to choose what to do next.
If your childcare centre is sitting at 60% occupancy or below, the empty places can be hard to ignore. With wages, rent and other commitments to meet, you need to understand what is happening and which action deserves attention first.
Your room mix, booking patterns, staffing requirements and costs determine what this percentage means for your service.
A recent conversation among childcare owners raised questions about affordability, competition, changing work patterns and whether bookings would pick up later. Those are useful issues to investigate. One conversation cannot establish how the whole sector is performing, or explain your centre's current occupancy.
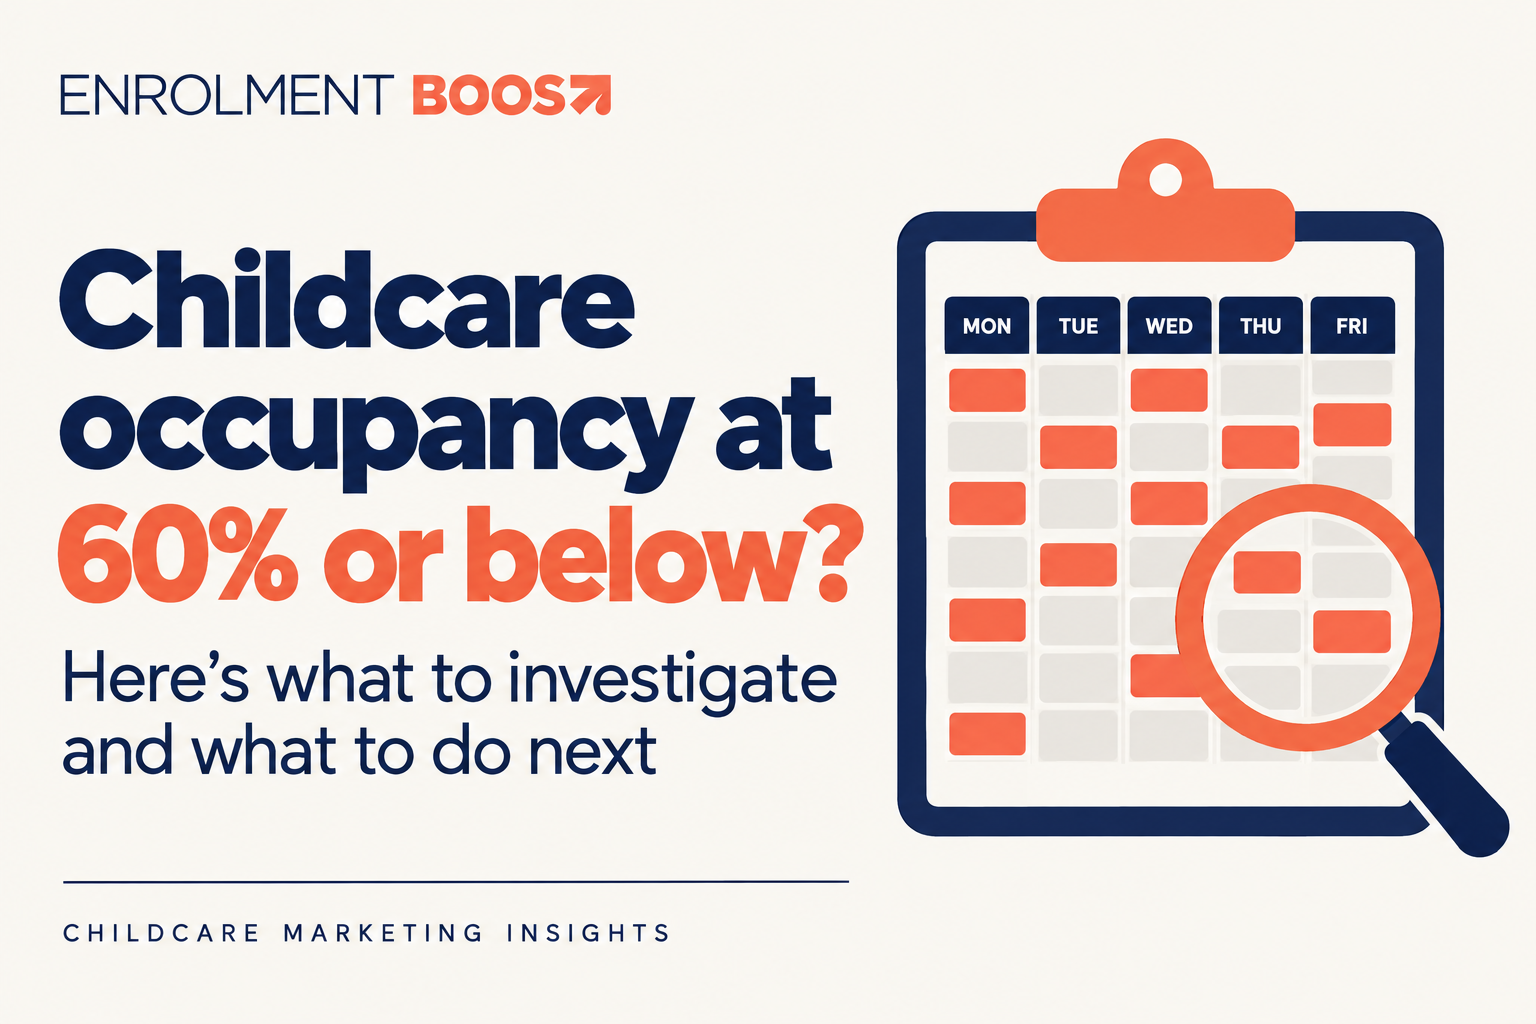
This guide explains how to investigate current occupancy at 60% or below and build a practical improvement plan. Forward bookings are covered separately, so future possibilities do not hide today's gaps.
The short answer
Start with current booked child-days by room and weekday, then compare attendance and fee revenue separately. Check the trend across comparable trading periods and identify whether the largest gap is suitable local demand, enquiry conversion, retention or the days families need. Use those findings to choose your next action.
A 60% figure alone cannot tell you whether the service breaks even, how it compares with the market or how urgent its position is. Check your own costs and cash flow. Waiting for a seasonal lift, changing fees or increasing advertising without understanding the gap can waste valuable time.
First check what your occupancy figure measures
Use a defined current trading period, such as the last completed week, and review several comparable weeks alongside it. Keep bookings for children who have not started in a separate forecast. A promised future start does not fill a place today.
Booked occupancy, actual attendance and fee revenue answer different questions. A child who is absent may still hold a booked place. Illustratively, 180 booked child-days out of 300 gives 60% booked occupancy; if 162 are attended, attendance is 54%. Neither percentage alone tells you what fees were collected.
Write down the reporting date, period, numerator and denominator. Is the figure a daily snapshot or a weekly or monthly average? Are you dividing by approved places or the places you can actually offer with your staffing and room arrangements? Use the same basis when comparing periods.
Keep both capacity views visible. Reducing the number of places you offer can lift the reported percentage without adding a single booking. It may be operationally sensible, but it does not remove the cost of unused capacity.
ACECQA explains that a service approval sets the maximum number of children who can be educated and cared for at one time. Educator ratios, qualification requirements and adequate supervision also matter. Ratio calculations are service-wide, with age and jurisdictional requirements; a room-by-day planning sheet is not a substitute for a compliant roster. See ACECQA's staffing guidance.
Count booked child days rather than names on a list
For a centre offering daily places, one child booked for three days contributes three booked child-days each week. Fifty children attending three days each create 150 booked child-days. Fifty attending two days create 100. The unique-child count is identical, but the booking position is very different.
Use this calculation for the same period and capacity basis:
Booked occupancy = booked child-days ÷ available child-days × 100
For mixed session models, use a consistent place-session or place-hour measure as well. Do not count two non-overlapping short sessions as two full-day places.
Illustrative example: A 60-place centre offers all 60 places across five weekdays, giving 300 available child-days. Its current weekly bookings look like this. These are invented figures, not sector benchmarks.
| Room | Daily places | Mon | Tue | Wed | Thu | Fri | Booked each week |
|---|---|---|---|---|---|---|---|
| Nursery | 12 | 10 | 12 | 12 | 10 | 6 | 50 of 60 |
| Toddlers | 20 | 10 | 18 | 18 | 16 | 8 | 70 of 100 |
| Preschool | 28 | 8 | 17 | 16 | 12 | 7 | 60 of 140 |
| Total | 60 | 28 | 47 | 46 | 38 | 21 | 180 of 300 |
The headline is 60% booked occupancy. Yet the nursery is full on Tuesday and Wednesday, while preschool and Friday have much larger gaps. Advertising broadly for babies could produce enquiries you cannot accommodate, while leaving the real vacancies untouched.
Turn the table into a vacancy map. For every opening, specify the child's age range, days, earliest start date and any operational constraint. Check each proposed booking against that map.
Compare like for like before drawing conclusions
Compare the last completed week's booked occupancy with recent comparable weeks and the equivalent seasonal period last year. A single quiet week may not describe the underlying trend. Check whether changes reflect fewer children, fewer days per child or a different amount of available capacity.
Check:
- Booked child-days and attendance, reported separately on consistent definitions
- Equivalent weekdays, school-holiday periods and any temporary closures
- Available capacity, room configuration and opening days in each period
- School-leaver departures, other exits and agreed room-transition dates
- Starts, withdrawals and booking-day changes between reporting periods
If historic records use a different measure, explain the limitation rather than presenting a false comparison. Reconstruct figures only where dated records support them. Save weekly snapshots now so you can distinguish a sustained decline, a stable gap and a genuine improvement.
Some centres may build bookings after the holiday period. Your own records can show whether that happened, how much was added and which rooms benefited. Test seasonal assumptions against current enquiries and confirmed starts instead of relying on February to fix a present gap.
The Department of Education's quarterly CCS reports provide context on children, families, services, fees and subsidies. They do not establish your centre's current occupancy or explain its specific vacancies. National usage figures cannot tell you whether your Friday preschool vacancies will fill.
Keep forward bookings separate from current occupancy
Prepare a separate forecast for the next four, eight and twelve weeks. Compare forward bookings with the same lead time last year where records allow. Give each record a clear status:
- Confirmed new booking: agreed days and start date, with the centre's enrolment requirements completed
- Reconfirmed continuing booking: the family has checked and agreed its future booking pattern
- Awaiting confirmation: an existing pattern or verbal intention still needs checking
- Forecast opportunity: an enquiry, tour or waitlist entry that may become a booking
Confirmed new and reconfirmed continuing bookings belong in the forecast from their effective dates. Count each child once. Reconfirmation does not add another booking, and a future booking does not increase the current-period occupancy total. Keep unconfirmed intentions and opportunities separate.
Record one child, one booking pattern and its effective dates. A toddler moving to preschool frees a toddler place and uses a preschool place; the move does not create a new centre enrolment. Remove a school-leaver from their actual departure date, rather than assuming every child leaves at the end of December.
Show a confirmed baseline, a cautious forecast and an upside scenario, with the child-days, dates and possible withdrawals behind each. For a step-by-step way to check stale entries, reconfirm family needs and match whole booking patterns to vacancies, use our guide to turning a waitlist into a clearer enrolment plan. An assumed conversion rate should never turn an enquiry into a confirmed place.
Find out which problem you actually have
Different centres can sit at 60% occupancy or below for very different reasons. The percentage identifies the size of the gap; your evidence should explain its cause.
Local demand or visibility
Are fewer suitable families enquiring, or are you receiving enquiries for ages and days you cannot offer? Compare enquiry sources and requested places with your vacancy map. If local families are not finding you, our childcare SEO guidance explains which Google Business Profile details, centre pages and local search measures to check. Start with the rooms and days you can offer, accurate hours and useful answers for those families.
Competition, work-from-home patterns and household budgets are hypotheses until local evidence supports them. Ask families what matters to their decision. If families find you but cannot see whether you suit them, work through our AI visibility action plan: verify the centre's facts, explain the actual experience and test the journey from an answer to an enquiry. Those website improvements also help families arriving through other routes.
Enquiry and tour conversion
If website visits are not becoming enquiries, check the experience on a phone. Can families find the relevant age group, hours, inclusions and a clear way to contact you? Does a test enquiry reach the right person? Our childcare website guide covers these practical checks. Where suitable enquiries do arrive, review how families book a tour and whether the visit answers their specific questions.
Give your team a named enquiry owner and backup, with realistic response standards. Our enquiry and tour conversion guide explains the stages to track and how to review availability, response, tour experience and timing. Use it to choose the team's next improvement, then agree the next helpful contact with each family. Your centre handles the communication; Enrolment Boost helps analyse gaps and train the team.
For a practical checklist to use before, during and after the visit, read our guide to running a childcare tour that helps families decide.
Retention and attendance patterns
Check departures and reduced booking days separately from new enrolments. Ask respectfully whether changes relate to school, relocation, cost, work arrangements or the service experience.
Illustrative example: Ten continuing children each dropping one booked day removes ten child-days a week, even though the centre has lost no enrolled children. In the 300-child-day example, that reduces booked occupancy by 3.3 percentage points.
An absence from a booked day is different from a family permanently dropping that day. For new families, check the handover from enrolment to the room team, orientation arrangements and unanswered questions before the start date. Agree who checks in during the first weeks and records concerns and actions. These conversations can identify service issues; they cannot prevent every departure.
Use our first 30 days checklist to review the handover, orientation and early check-ins.
Measure the full path from enquiry to start
Follow the same group of enquiries through to its outcome. Dividing this month's starts by this month's enquiries mixes families at different stages and can produce a misleading conversion rate.
Illustrative completed cohort: Assume 100 genuine child-level enquiries, with duplicates removed. All agreed start dates have passed. Fifteen children started and three enrolled children withdrew before starting.
| Stage | Number | Conversion from previous stage |
|---|---|---|
| Enquiries | 100 | Starting group |
| Tours booked | 60 | 60% |
| Tours attended | 45 | 75% |
| Enrolments completed | 18 | 40% |
| Children started | 15 | 83.3% |
Overall enquiry-to-start conversion is 15%. These invented rates are a calculation example, not targets or evidence of typical centre performance.
If those 15 children each start three days a week, they add 45 booked child-days. Added to the example's 180, that gives 225 out of 300, or 75% booked occupancy, before departures or reductions. This illustrative improvement requires their ages, days and start dates to fit the vacancies. It is not a forecast or guarantee.
For live cohorts, show pending outcomes separately. A child whose agreed start date is still ahead has not failed to start. Track siblings at child level while linking the family enquiry, so one tour does not accidentally become two unrelated family leads.
Use the stage with the largest evidenced gap to choose the next action. Few tours booked: check availability, response and offered times. Booked tours not attended: check confirmation, directions and rescheduling. Attended tours not becoming enrolments: ask what remains unresolved about fit, care, cost or the next step. Enrolments not starting: check agreed dates, paperwork and pre-start contact. Keep pending decisions separate and record the family's reason where they choose to share it.
Make affordability easier to understand
Affordability deserves a careful conversation. The ACCC's childcare inquiry, released in January 2024, found that the July 2023 subsidy reforms improved affordability, while lower-income households still spent the largest share of disposable income on care. It also highlighted the highly local nature of childcare markets. These are historical findings, not a diagnosis of every family's circumstances in 2026. See the ACCC's final inquiry findings.
The 3 Day Guarantee began on 5 January 2026. All CCS-eligible families can access at least 72 subsidised hours per fortnight, regardless of activity levels. Families must still meet eligibility requirements, generally pay a gap fee and secure a place. Some circumstances provide 100 hours. The guarantee does not mean three free days or a guaranteed vacancy. See the Department of Education's current provider guidance.
Explain hours alongside your actual session lengths. For example, three 12-hour sessions each week use 72 hours over a fortnight; three 10-hour sessions use 60. Check the family's approved hours and other care arrangements before estimating costs.
Services Australia applies the family's CCS percentage to the lower of the hourly fee and the applicable hourly rate cap. It normally withholds 5% of the subsidy to reduce overpayment risk. A simple percentage discount from the daily fee may therefore give the wrong out-of-pocket estimate. Refer families to Services Australia's assessment explanation.
Give families a written estimate with the gross session fee, booked hours, subsidy assumptions, relevant cap, withholding and estimated amount payable. Explain inclusions and additional charges. Services Australia confirms entitlement; your estimate should make its assumptions clear.
Our customised CCS calculator can make this conversation easier. It is configured to your centre's actual fees, including different room rates where needed, and uses the information a family supplies to show a personalised, indicative out-of-pocket estimate. Families can explore costs on your website, then take the next step with your team. You can see the platform and live demo on our CCS calculator website.
Place it where families are considering fees and explain what happens after they submit their details. Treat a calculator enquiry as a starting point: check the child's age, requested days, start date and remaining questions. A completed calculation is not an enrolment, a confirmed subsidy entitlement or a promise of the family's final bill.
Check the economics before changing fees or advertising
A blanket fee cut affects existing bookings as well as prospective ones. Work out how much revenue you would give up, the realistic additional child-days required and any staffing costs triggered by those bookings. A fee increase also needs a clear cost rationale and an honest assessment of family affordability and retention risk.
Review applicable funding conditions and CCS requirements before introducing fee changes or promotions. There is no universal break-even occupancy percentage you can safely borrow from another centre. Sixty per cent is not a financial safety line or a sector benchmark.
Build your own forecast with your accountant or finance adviser using fees actually collected, staffing requirements, rent, operating costs, funding conditions and cash-receipt timing. Test your current booking level and a lower scenario as well as improvement. If expected receipts do not cover near-term commitments, address that cash-flow gap promptly. Extra fee revenue is not the same as extra profit, especially when another educator is required.
Use our vacancy cost calculator to explore the gross fee opportunity between your current occupancy and a selected target. Replace its assumptions with your own fees, operating weeks, departures and conversion figures. Its annual estimate assumes that target is held for the year; it is not profit or a prediction. Bring staffing and other costs back into your own forecast.
Increase advertising when you know which vacancies to promote and can handle suitable enquiries. If the evidence points to response or tour problems, work through the conversion guide first. Track cost per started child and child-days gained alongside lead costs, so a cheaper enquiry is not mistaken for a better occupancy result.
A practical 30 day plan
Days 1 to 7 establish the real position
Export bookings, attendance and revenue for the last completed week and recent comparable periods. Build the current room-by-day vacancy map and a separate forecast. Reconcile departures and transitions, compare capacity consistently, and check near-term cash commitments. Give each unresolved record an owner and review date.
Days 8 to 14 speak with families and check the process
Speak with families about reduced days or planned departures and confirm changes to continuing bookings. Check relevant waitlist entries for current needs. Review recent enquiries and tours for unanswered questions, unsuitable days and unclear next steps. Run a short team practice on explaining availability, fees and CCS estimates.
Days 15 to 21 fix the largest evidenced gap
Choose a focused action based on the findings. That might be making tours easier to book, improving the tour experience, clarifying session costs or promoting genuine room-and-day vacancies locally. Agree what success will look like and who will do the work. Change a small number of things so the results remain interpretable.
Days 22 to 30 check whether the position improved
Refresh the current occupancy map and compare it with day one on the same basis. Count actual starts, child-days gained, cancellations and reductions separately. Keep future starts in the forecast and pending enquiry outcomes visible. Update cash-flow scenarios and decide what to continue, change or stop. Thirty days should produce a clearer position and tested actions, not a promised occupancy result.
Copy and use this occupancy audit
Use one copy for each current reporting period, with a separate forward-booking sheet. Keep family details in your normal secure system.
- Reporting date: ______ Current period: ______ Review owner: ______
- Capacity basis, approved places and operational limits: ______
- Each room and weekday: available places / confirmed bookings / vacancies: ______
- Booked child-days: ______ ÷ available child-days: ______ × 100 = ______%
- Comparable recent and prior-year figures, plus limitations: ______
- Attended child-days: ______ Fees collected and cash-flow gaps: ______
- School-leaver departure dates and room transitions reconciled: yes / no
- Future confirmed bookings and opportunities kept separate from current occupancy: yes / no
- Duplicates, sibling records and transferred room bookings checked: yes / no
- Enquiry cohort and review date: ______
- Enquiries: ______ Tours booked: ______ Tours attended: ______
- Enrolments: ______ Started: ______ Pending: ______ Withdrawn: ______
- New child-days gained: ______ Child-days lost or reduced: ______
- Main gap supported by evidence: demand / conversion / retention / day pattern
- Affordability questions and next helpful response: ______
- First action: ______ Owner: ______ Due date: ______
- Measure of progress and next review date: ______
Start with the part you can verify
If your centre is at 60% occupancy or below, start with the places that are empty now, the families you can genuinely accommodate and the costs you need to cover. A clear diagnosis gives your team a more useful next step than a reassuring prediction or a blanket marketing push.
At Enrolment Boost, we help centres generate relevant enquiries, understand conversion gaps and train their teams to improve the enquiry and tour process. Your centre keeps ownership of its relationships and family follow-up.
If you are unsure which part of the journey deserves attention first, start with our free Centre Audit. Answer questions about visibility, trust, reviews, follow-up, tours and conversion, then use the immediate summary and suggested actions to guide the team discussion. It is based on your answers, so check the findings against your booking records and financial position. You can also request a personal review from Martin.